User interface
This section describes the rNAV user interface. If you need some additional information on an element move the cursor on it and press F1 to get access to its help page.
Overview
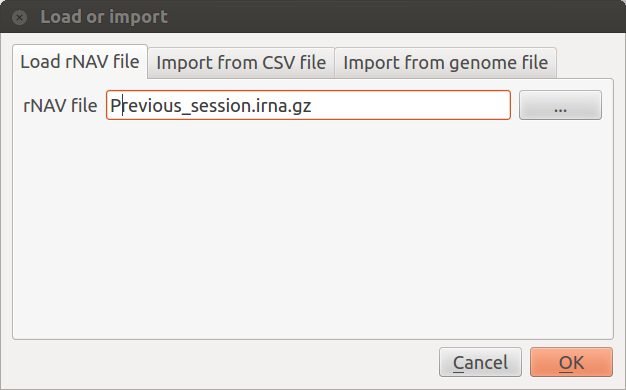
This is the GUI of rNAV.
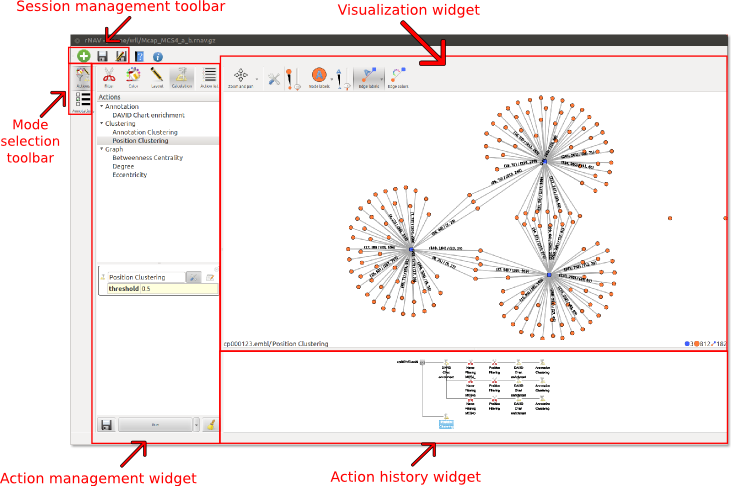
When Annotations button is clicked, the Annotation widget replaces the Action management widget:
Toolbar (Session management toolbar)
The toolbar contains all the session management buttons. It allows to create, import and save sessions.
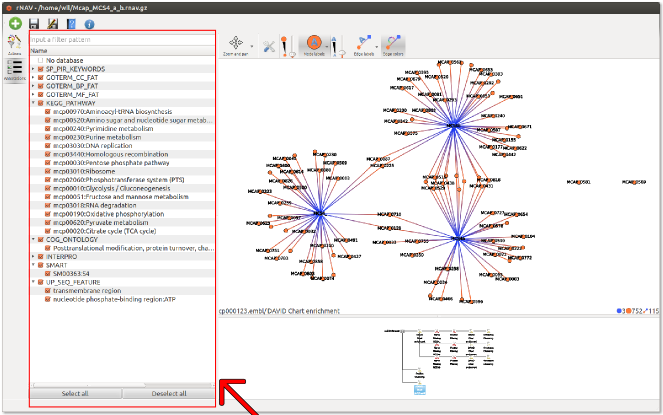
 Load or import: This will open the Load or import window which provides 3 ways to load data.
- Load rNAV file: Load a saved session. Loading a session will replace the current session.
- Import from CSV file: Import new data from rNAV csv files. You need two files: one for nodes information and the other for edges information. Importing new data will close the current session.
- Import from genome file: You need again two files: one containing the whole genome (in genbank or embl format) and the other containing your query sequences (i.e. sRNA sequences file) in fasta format. Importing new data will close the current session.
 Save: Save the current session into the last file or into a new one if the current session was not saved before.
 Save as: Save the current session into a new file.
 Help: Show this manual :-)
Import from CSV file
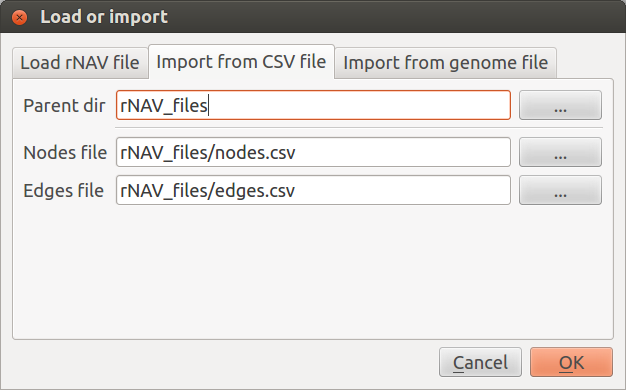
To import data rNAV needs two distinct CSV files. One for nodes information and the other for edges information. Use the Node file and Edge file fields to set nodes and edges path.
If the two files are in the same directory you can use the Parent dir field to find them automatically these two files. To be detected the name of the node file must match the pattern “*nodes*.csv” and the edge file the pattern “*edges*.csv”.
CSV file format supported by rNAV is described in the chapter CSV files.
Import from genome file
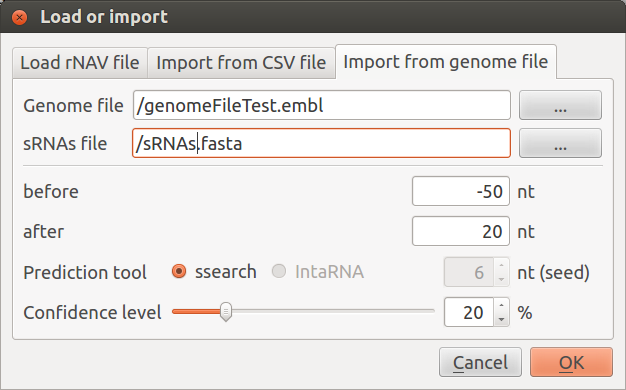
To import data from a genome file rNAV needs two distinct files:
- the genome file in genbank or embl format. If you plan to use the DAVID [1] Chart enrichement feature, your genome file must contain the UniprotKB gene identifiers.
- your query sequences file in fasta format.
This import module will:
- extract 5’ region of mRNAs: you can choose the size of the extracted region by setting the value of the two parameters ‘before’ and ‘after’ which are respectively the number of nucleotides before the start codon and after the start codon.
- predict interaction using ssearch or IntaRNA [2]. If IntaRNA appears disabled, it means that IntaRNA was not (properly) installed and rNAV did not find it. See compilation instruction in rNAV2.0./INSTALL file to fix this problem.
- build the visualization
You can find the prediction tool output file in the .rNAV2.0/ directory, inside your home directory.
Action management widget
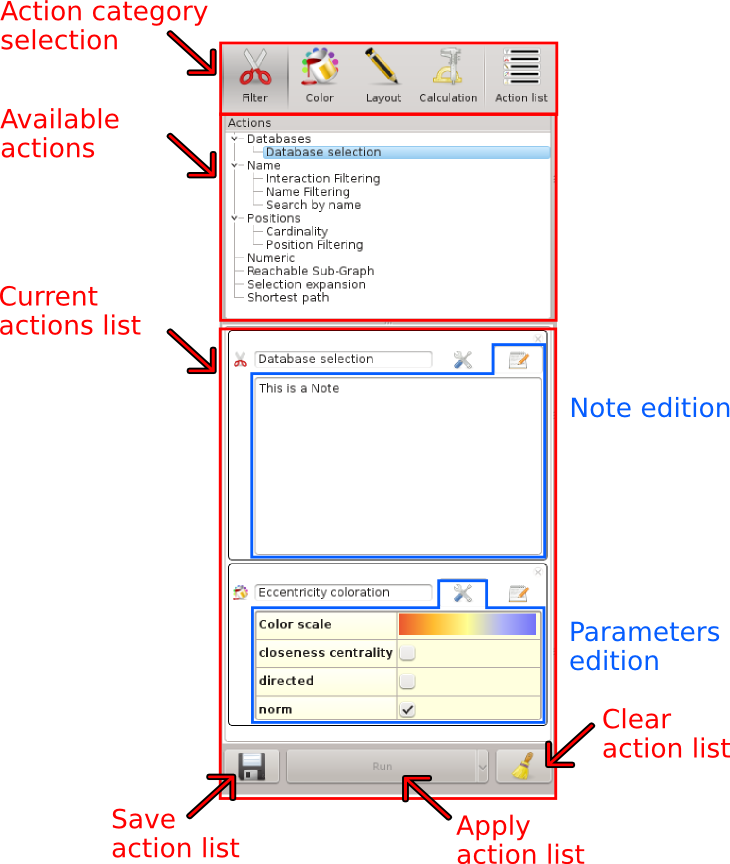
This widget is used to list, configure and apply actions on the data.
To show the action management widget click on the Actions ![]() button in the bar on the left.
button in the bar on the left.
Available actions widget
This widget lists all the available actions in rNAV. They are grouped in 4 categories:
 Filter: These actions are used to filter or select elements in the data.
 Color: These actions are used to compute colors for each element.
 Layout: Use these actions to change the positions of each element.
 Calculation: Compute data for each element.
The last category  Action list contains the lists of actions created by the user. An action list is a combination of actions configured by the user. It allows to store and reload quickly frequent tasks.
Add actions
To add an action or an action list in the current actions list you can either double click or drag and drop the element in the current actions list.
Quick apply
You can also quickly apply an action or an action list on any element in the visualization widget by drag and drop. You cannot edit action name, notes or parameters when you quick apply it.
Current actions list
This widget allows the user to edit, configure and apply actions on the displayed states. This is the stack of actions that will be applied sequentially to all visualized states.
Action widget
You can add new actions by double click or drag and drop elements from the Available actions widget. For each action you can:
- Change the action position in the list
- Remove it
- Edit action name
- Edit action parameters
- Add notes
- Change filter actions behavior
Change the action position
If the an action is at the wrong position in the list you can change it by drag and drop. Click on the action widget hold left button and move the action to the right position. The list will be automatically updated.
Remove an action
To remove an action from the list just click on the cross icon in the top right corner of the action widget.
Edit action name
The action name is the short label displayed under the state in the Action history widget. To edit the name just input the new name in the line editor containing the current name.
Edit action parameters
Some actions can be configured to change their behavior.
To show the parameters edition table click on the  button.
If the action has no parameters this button is shaded and you cannot click on it.
Click on a parameter to switch to the edition mode. To validate the parameter modification press enter or click outside of the parameter cell. If you want to cancel the edition press the escape key.
Add notes
Click on the  button to show the note edition widget.
Input your text and click again on the button to hide it.
These notes can be displayed later in the Action history widget.
Change filter action behavior
You can change the behavior of a filter action to update selection instead of filtering elements.
When you have a filter action click on the  icon at the left of the action widget to switch to the selection mode
  .
If you want to go back to the filter mode click on the icon again.
Action list management
Apply action list
To apply the current action list on all the visualized elements click on the run. There are two ways to apply actions :
- Run : Apply the actions list and keep actions.
- Run and clear : Apply the actions list and clear actions.
Save current action list
If you want to save the current list click on the button  .
Input the name of the action list and click on the OK button, if an action list with the same name already exists a dialog will ask you if you want to overwrite it.
Clear current action list
Press this button  to clear the current action list.
Annotations widget
To show the annotation widget click on the Annotations button  in the bar on the left.
This widget lists all the annotations present in the data and allows the user to show or hide elements related to annotations. For example user can hide all the annotations coming from the database called (DB_)KEGG_PATHWAY by unchecking it. Elements with no annotation are grouped in the No database element.
- The list has two levels:
- Database level : the first level groups all the databases present in the data and the No database element. To hide all the annotations coming from a database just click on the check box next to it.
- Annotation level : the second level contains all the annotations for the parent database. To show or hide an annotation just click on the check box next to its name.
Some elements are shared by multiple annotations. To hide an element all of its annotations must be hidden. For example if an element has two annotations A and B if you uncheck A the element will be still visible. To hide it you must uncheck annotation B too.
If you want to filter annotations input a filter pattern in the line edition widget at the top of this widget. This filter accepts regexp (see Qt regexp documentation for more information http://qt-project.org/doc/qt-4.8/qregexp.html).
The Select all button checks all the annotations and the Deselect all hides them all.
Visualization widget
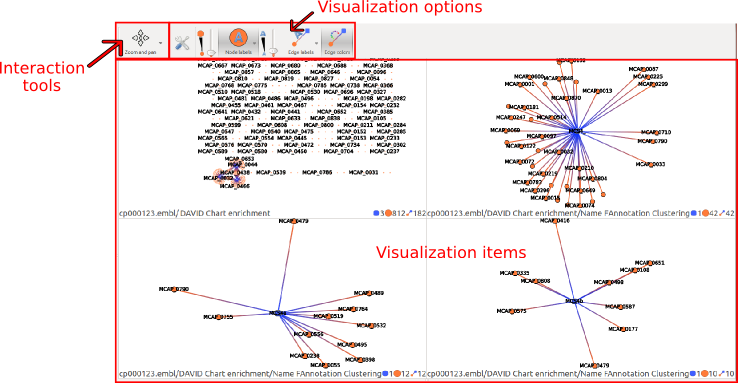
This widget provides a visualization for each state selected in the Action history widget. To add or remove a visualization of a given state update its selection state in the Action history widget.
Visualization item description
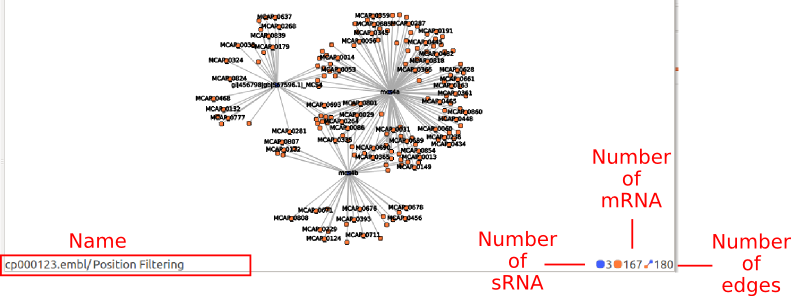
Each visualization items displays a specific state of the data. The name of the item is composed by the name of the current state and the name of all its ancestors.
The number of mRNA, sRNA and edges can change if you filter elements with the annotation widget. You can display both visible and total elements number by hovering the element number icon or label until a tooltip appears.
Interaction tools : Zoom, Selection and Neighbors
There are three interaction tools:
 Zoom and pan
 Element selection
 Neighborhoods analysis
 Zoom and pan
This interaction tool is used to navigate into the drawing.
Press the left button and move the mouse to move into the selected view. You can zoom in and zoom out using the mouse wheel.
Once you have finished to interact on a state all the other visualized states will center on their visible elements.
 Element selection
This tool is used to select elements in the visualized states. Select all elements intersecting the selection box (the previous selection is replaced). With Ctrl, the newly selected elements are added to the current selection; with Shift, the selected elements are removed from the current selection.
You can zoom in and zoom out using the mouse wheel. Once you have finished to interact on a state all the other visualized states will center on their visible elements.
 Neighborhoods analysis
This tool is useful for analyze the neighborhoods of a node. It has two modes:
- Navigation mode
- Neighborhoods analysis mode
Neighborhoods analysis mode
In this mode all the visualized states containing the analyzed node will show the neighborhood of this node.
Here is a description of the neighborhood analysis object.
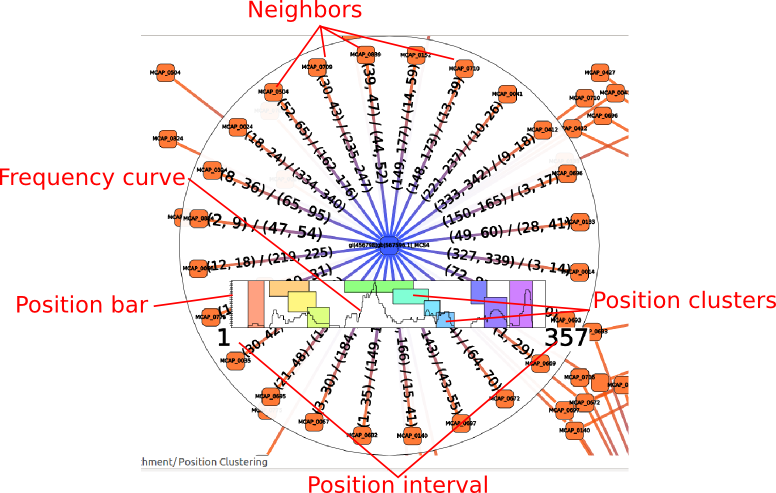
Neighbors
The neighbors of the analyzed node.
Position bar
This bar represent the position of the predicted interactions for the analyzed node. It’s width is proportional to the length of the sRNA.The bottom right and bottom left numbers represents the start and the end of the sRNA (though this interactor also works on mRNAs).
To select a range in the interval right click on the start position in the position bar and move the mouse to the end position all the elements not in the selected interval will be hidden.

- When releasing the mouse button the elements in the selected interval will replace the current selection:
- use Ctrl key to add elements to the current selection
- use Shift key to remove elements from the current selection.
Position clustering

Each colored box represent a cluster of neighbors that interact with the sRNA at similar positions. They are not computed by default, if you want them you had to call the Position clustering action in the Calculation group. Hover a cluster to show only edges in this cluster. You can select a cluster by clicking on a colored box, it will replace the current selection (use Ctrl key to add elements to the current selection and shift key to remove elements from the current selection).
Frequency curve
The curve of the number of mRNAs interacting at each position of the sRNA.
Visualization options
 Node size
Move the slide to update the size of the nodes in all the data. There is no way to update node size only for a given visualization.
 Node labels
Allows the user to enable, disable or select the labels for nodes.
Click on the down arrow on the left of the button to show the available kinds of labels. Click on the label you want to display to update visualization widgets.
- Name : use the name given in the data file.
- Length : display the length of the node.
- Computation result : display the last calculation result. This is valid only if the user have computed a calculation action or for certain color action.
 Edge labels
Allows the user to enable, disable or select the labels for edges.
Click on the down arrow on the left of the button to show the availables kinds of labels. Click on the label you want to display to update visualization widgets.
- Annotations : display annotations associated to each edge. If an edge has annotations from different databases the name of the annotation is prefixed by the parent database.
- Positions : display the interval of the edge.
- PValue : display the PValue of the edge (given in the source data).
- Similarity : display the similarity percentage of the predicted RNA-RNA interaction. Only available for graphs calculated with ‘ssearch’ prediction tool.
- Energy : display the energy score of the predicted RNA-RNA interaction. Only available for graphs calculated with ‘IntaRNA’ prediction tool.
- Computation result : display the last calculation result. This is valid only if the user has computed a calculation action or for certain color action.
 Edge colors
If this button is checked, the edge color is a gradient from the color of its source node to the color of its target node.
Action history widget
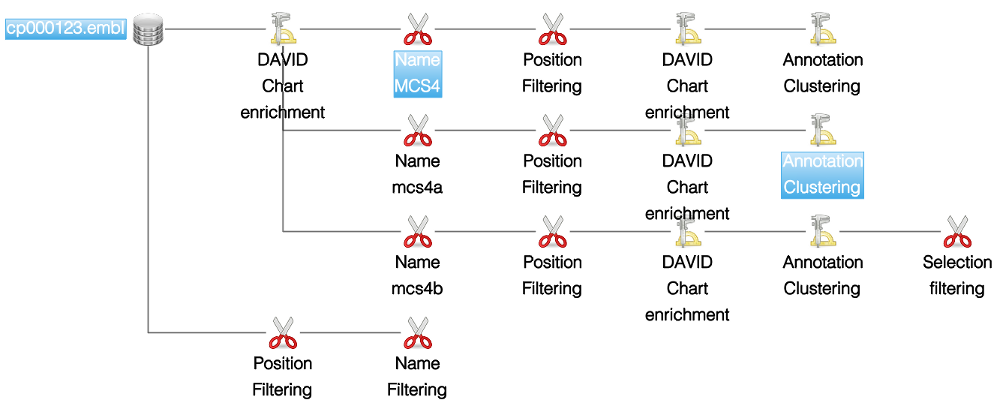
This widget shows graphically all the actions computed by the user. The history is represented by a tree of actions with the initial elements as root. Each time the user computes an action a new state is created and a link is added between the source and the final state.
All the selected states in this widget are displayed in the visualization widget.
Selection / Multiple view
- To select a single state click on it. To clear the selection click on an empty space.
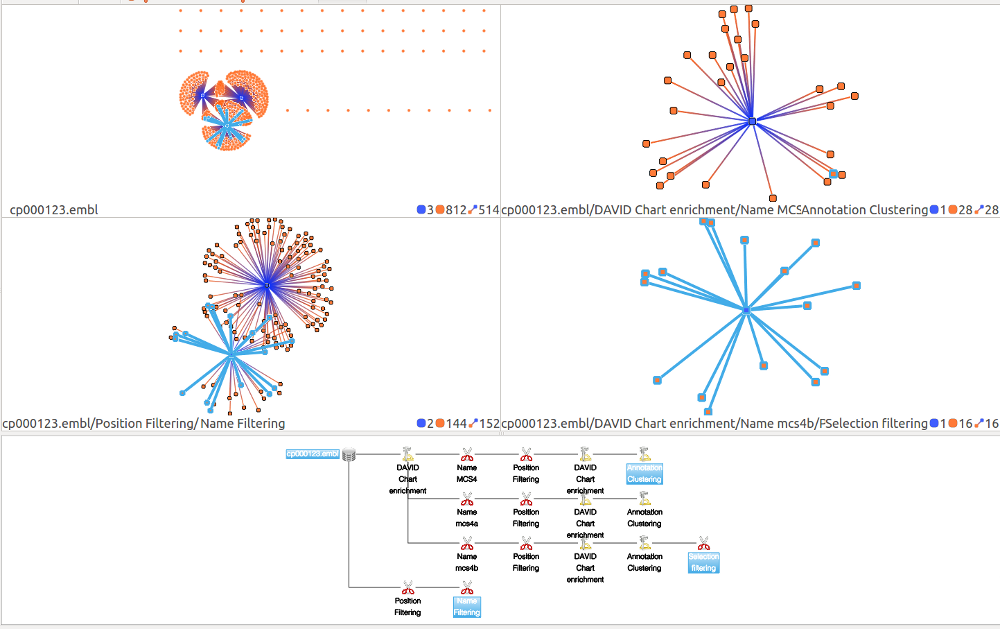
- To select multiple states, press the control button and click on the states you want. This will activate the multiple view mode. In the screenshot presented below, 4 states are selected therefore 4 views are displayed.
Name and notes
If you want to visualize name and notes for a state hover it and wait until the tooltip appears.
You can edit state name and notes either by double clicking on it or by the contextual menu (mouse right button click).
Use the widget to edit the name and the notes and click on the update button to apply the modification. To cancel the modifications click outside of the edition widget.
Delete selected states
You can delete all the selected states using the contextual menu. Click with the right button on the element you want to delete and select the Delete option. All the selected elements will be deleted. Be careful deleting a state will also delete all its children.
[1] D. W. Huang, B. T. Sherman, and R. A. Lempicki. Systematic and integrative analysis of large gene lists using david bioinformatics resources. Nat Protoc, 4(1):44–57, 2009.
[2] Anke Busch, Andreas S. Richter, and Rolf Backofen IntaRNA: efficient prediction of bacterial sRNA targets incorporating target site accessibility and seed regions - Bioinformatics, 24 no. 24 pp. 2849-56, 2008
