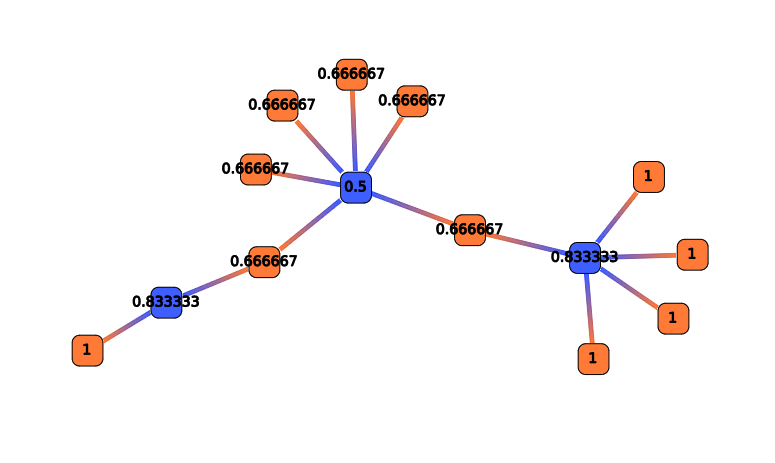
Actions
Actions are available in the Action list widget when Actions button ![]() is pressed.
is pressed.
 Filter actions
All these actions are designed to filter the network, which means that they lead to a smaller network. Each one can be used in “cut mode” or in “selection mode” .
 In cut mode, the resulting subnetwork will only contain the matching RNAs and interactions.
 In contrast, the selection mode will produce a resulting subnetwork same as the original with the matching RNAs and interactions selected.
 Cluster length
A Position Clustering is required before trying to launch this filter. See Position Clustering Annotation Clustering.
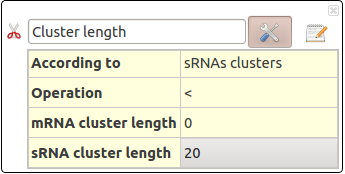
This action selects RNAs depending on their cluster length (in nucleotides).
This action take several parameters :
- According to : Select RNAs clusters concerned for this filters. Could be sRNA clusters, mRNA clusters or both.
- Operation : Define the comparison operator to use: =, >, >=, <, <=, !=
- sRNA cluster length : Length (in nucleotids) for sRNA cluster.
- mRNA cluster length : Length (in nucleotids) for mRNA cluster.
 Cluster size
A Position Clustering is required before trying to launch this filter. See Position Clustering Annotation Clustering.
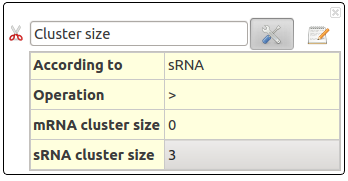
This action selects RNAs depending on their cluster size (in number of interactions).
This action take several parameters :
- According to : Select RNAs clusters concerned for this filters. Could be sRNA clusters, mRNA clusters or both.
- Operation : Define the comparison operator to use: =, >, >=, <, <=, !=
- sRNA cluster size : Size (in number of interactions) for sRNA cluster. This corresponds the number of mRNA targeted from one sRNA cluster.
- mRNA cluster size : Size (in number of interactions) for sRNA cluster. This corresponds the number of sRNA targeted from one mRNA cluster.
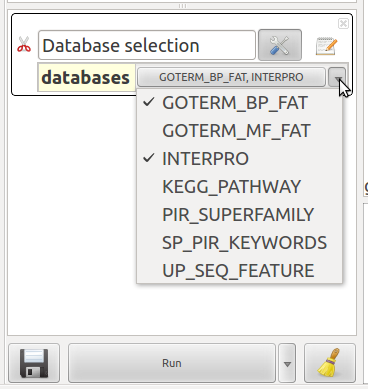
 Database selection
This action selects all the elements with at least one annotation from the selected databases. You can select as much databases as you want. You can only apply this action on an enriched network (use DAVID Chart enrichement action to enrich your network).
This action take one parameter :
- databases : check one or more databases in the pop-up list.
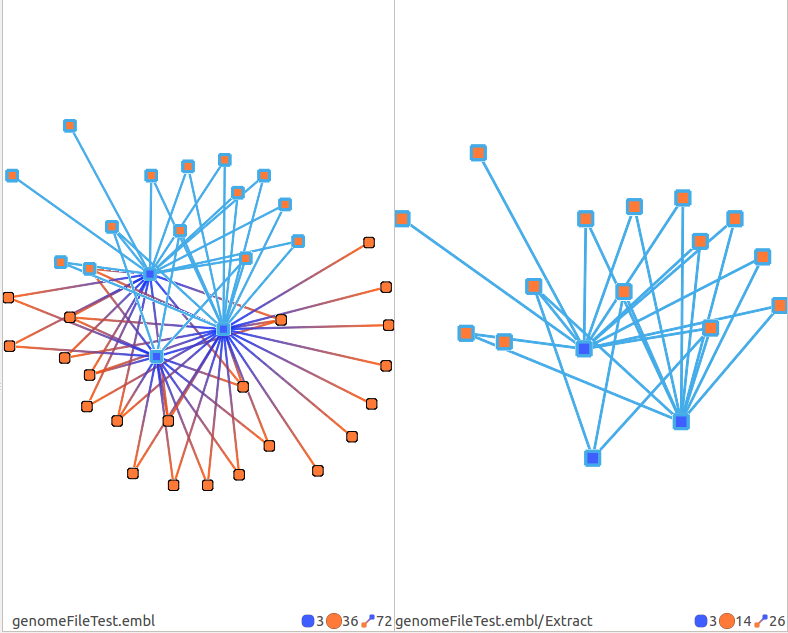
 Extract
Extracts current selection. Note that this filter expands the selections of interactions to the RNAs at their extremities.
Take no parameter.
 Reachable Network
Select a sub-network from your selection.
- distance: This parameter defines the maximal distance of reachable nodes.

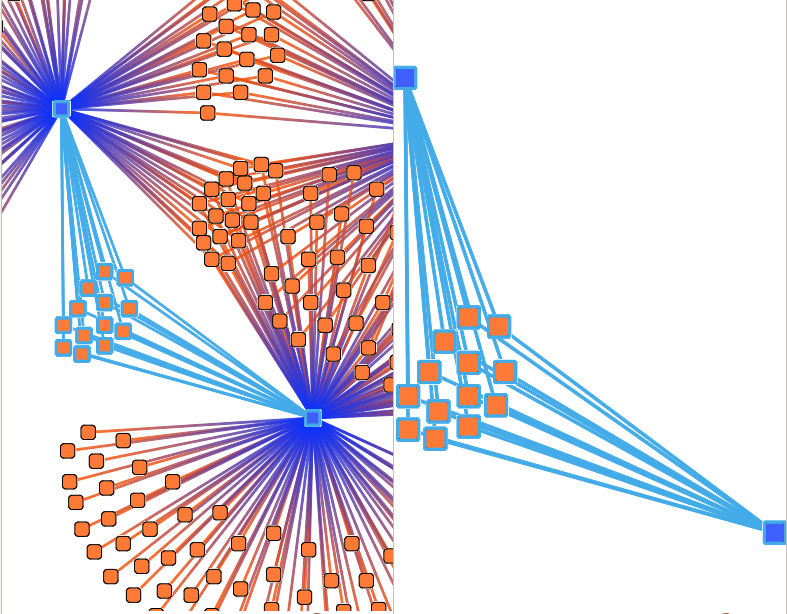
 Shortest path
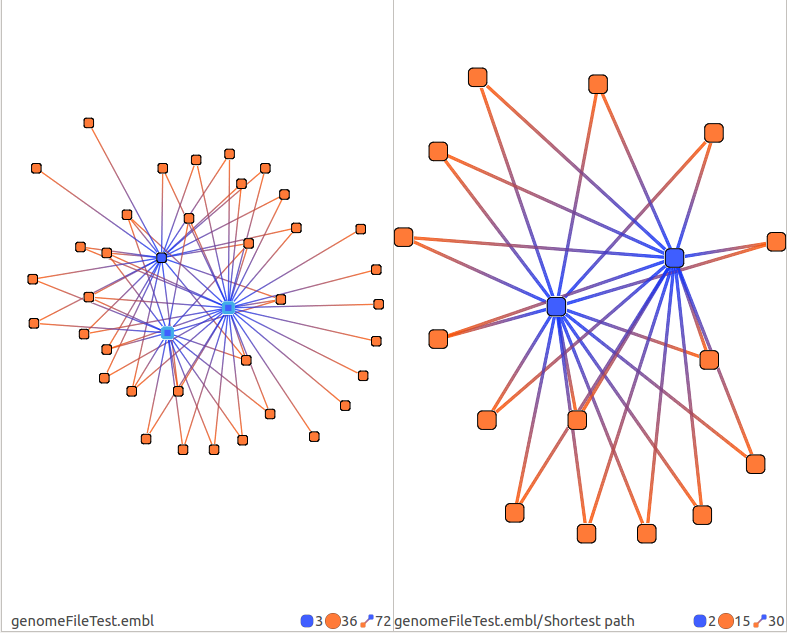
Computes the shortest path between the selected RNAs (mRNAs or sRNAs).
Take no parameter.
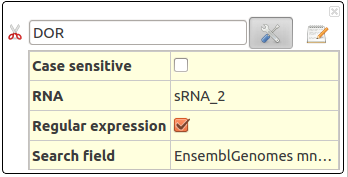
 DOR Dense Overlapping Regulon
Dense Overlapping Regulon : for a sRNA that regulates mRNA, find co-regulators sRNAs. (or for a mRNA that is regulated by a sRNA, find the co-regulated mRNAs)
For one sRNA which interacts with one mRNA, co-regulators are sRNAs that interact with the same mRNA. For one mRNA which interacts with one sRNA, co-regulated are mRNAs that interact with the same sRNA.
The DOR motif (Dense Overlapping Regulon) represents a coordinated response of the cell to several stress conditions. One sRNA can regulate several mRNAs and one mRNA can be regulated by several sRNAs.
This action take several parameters :
- Case sensitive : Distinguish between uppercase (capital) and lowercase (small) letters.
- RNA : Name (or regular expression) of searched RNA. Several RNAs can be asked in the form : RNA1,RNA2,RNA3.
- Regular expression : Allows regular expressions
- Search field : Search RNA by their name (UniProtKB), by their EnsembleGenomes (mnemonics) or by their Gene name.
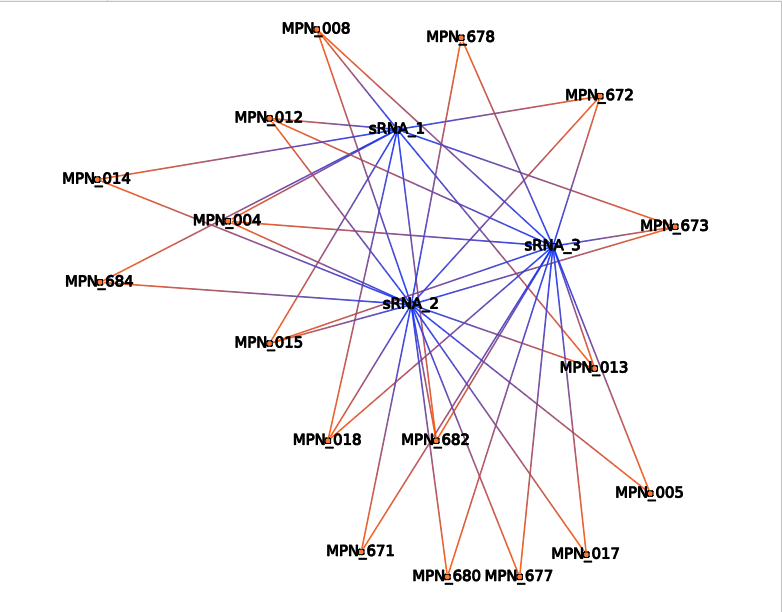
 Extract network from names
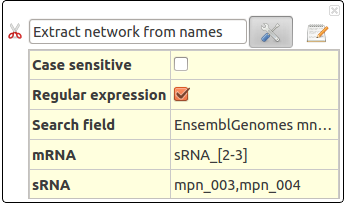
This action selects the specified sRNA and mRNA. The interactions are selected, if any.
This action take several parameters :
- Case sensitive : Distinguish between uppercase (capital) and lowercase (small) letters.
- Regular expression : Allows regular expressions
- Search field : Search RNA by their name (UniProtKB), by their EnsembleGenomes (mnemonics) or by their Gene name.
- mRNA : Name (or regular expression) of searched sRNAs. Several sRNA can be asked in the form : sRNA1,sRNA2,sRNA3.
- sRNA : Name (or regular expression) of searched mRNAs. Several mRNA can be asked in the form : mRNA1,mRNA2,mRNA3
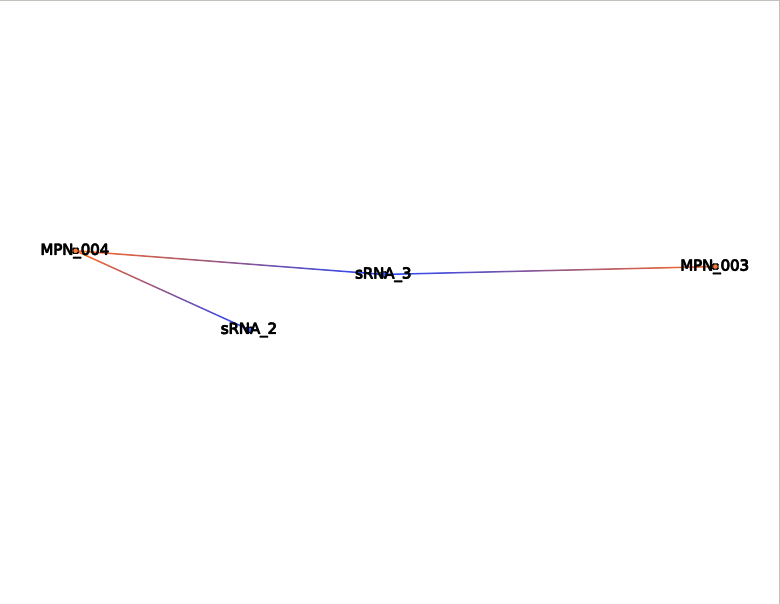
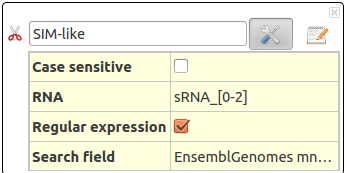
 SIM-like Single-Input Module
Single-Input Module corresponds to one sRNA regulating several mRNAs.
This action will select RNAs (sRNA or mRNA) according to their name and all associated interactions. It allows using regular expression.
This action take several parameters :
- Case sensitive : To distinguish between uppercase (capital) and lowercase (small) letters.
- RNA : To set the exact name of searched RNA. Several RNAs can be asked in the form : RNA1,RNA2,RNA3.
- Regular expression : Allows regular expressions
- Search field : Search RNA by their name (UniProtKB), by their EnsembleGenomes (mnemonics) or by their Gene name.
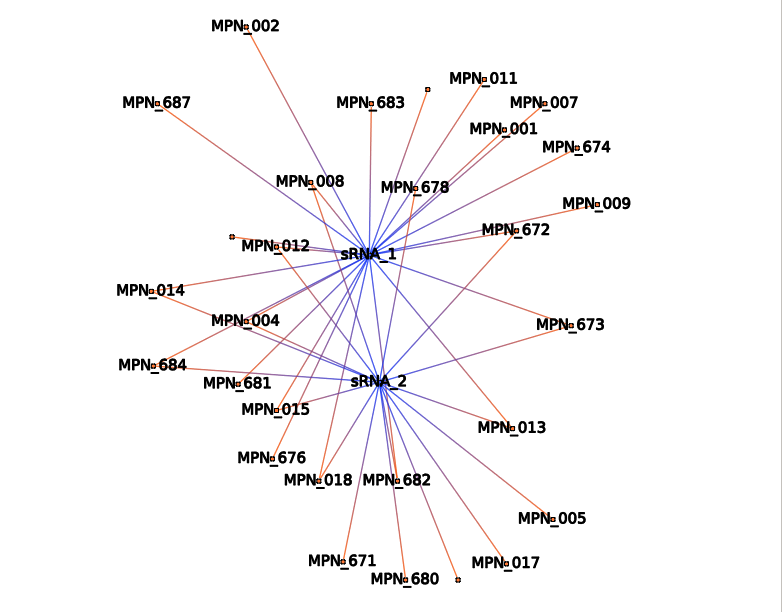
 Computation result
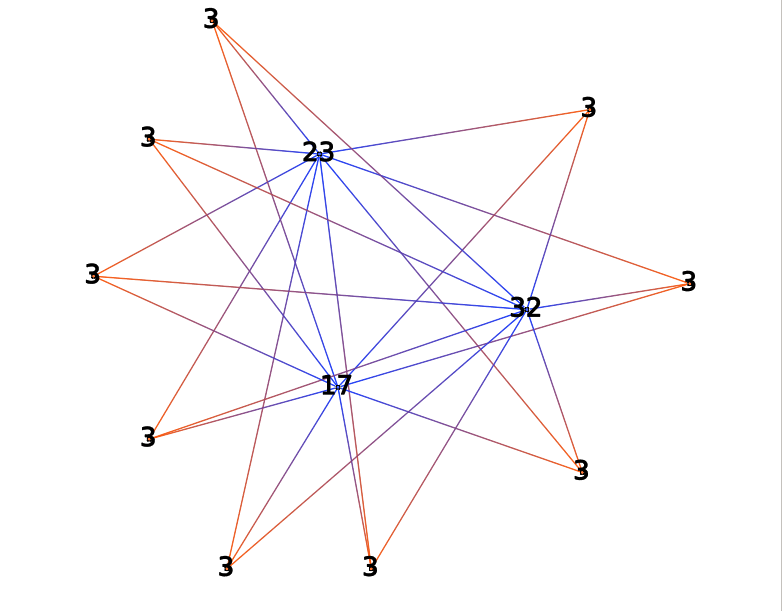
Filter RNAs according to the values of the last computed metric (i.e. Computation result in Edge labels menu and in Node labels menu).
parameters:
- Operation: Define the comparison operator to use: =, >, >=, <, <=, !=
- Value: the value to compare.
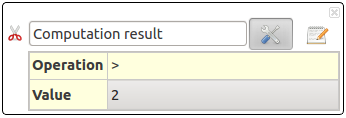
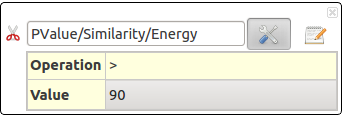
 PValue/Similarity/Energy
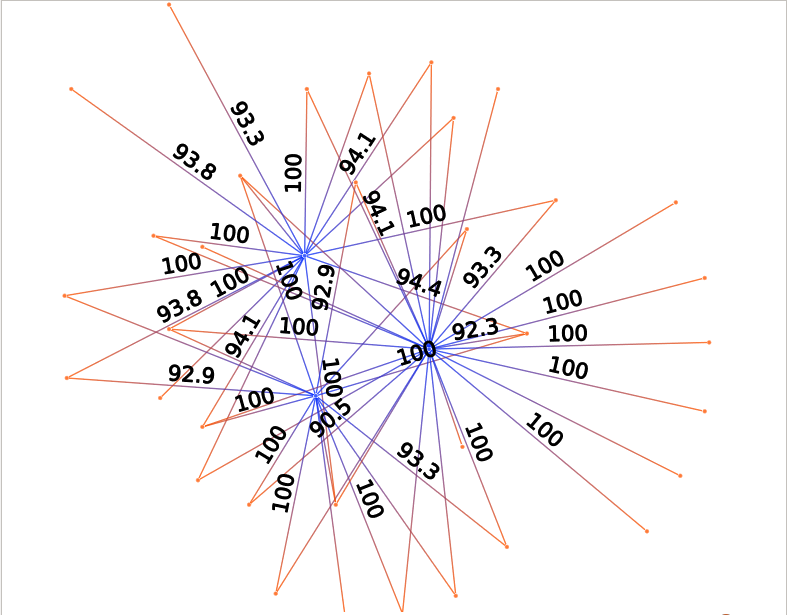
Filter RNAs according to the their PValue, Similarity or Energy value, depending on which one is present (i.e. Energy or Similarity in Edge labels menu).
parameters:
- Operation: Define the comparison operator to use: =, >, >=, <, <=, !=
- Value: the value to compare.
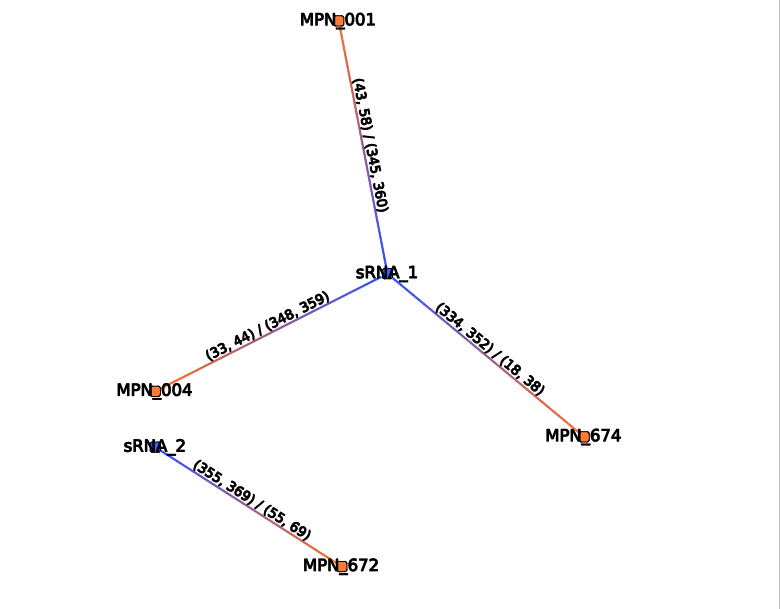
 Interaction Position
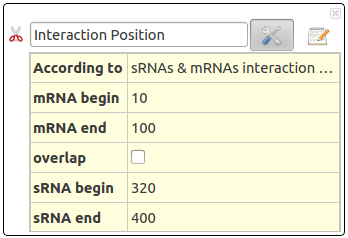
This action will select interactions according to their positions on the sRNA and mRNA.
This action take several parameters :
- According to : Select RNA gender concerned for this fitlering. Could be only sRNA, only mRNA or both.
- Overlap : Activate overlapping. By default, the results will only contain RNA with interaction position strictly between specified area (between begin and end). If overlapping activated, they will also contain RNA whose interaction position overlaps the specified area.
- mRNA begin : Start position of mRNAs interactions.
- mRNA end : End position of mRNAs interactions.
- sRNA begin : Start position of sRNAs interactions.
- sRNA end : End position of sRNAs interactions.
 Color actions
Their purpose is to color elements of the graph in an easily readable way.
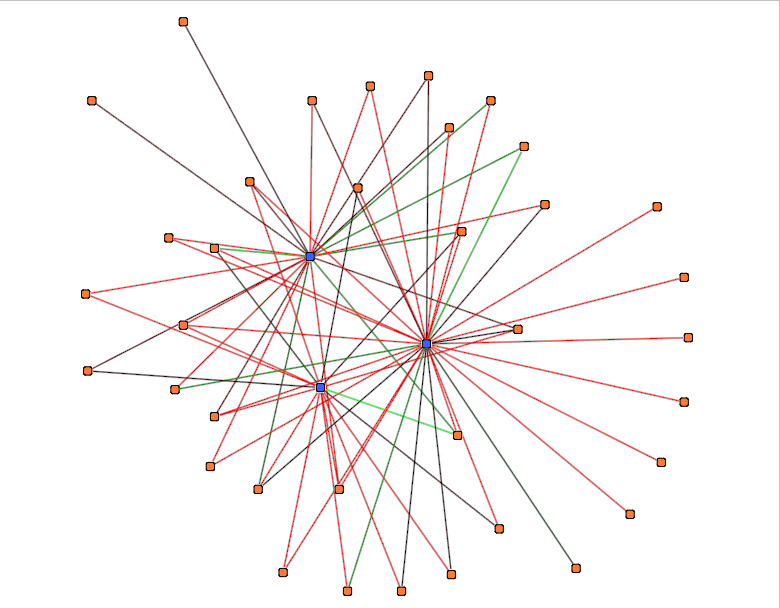
 pValue/Similarity/Energy
This action color edges in the graph according to their PValue/Similarity/Energy value (the present value).
You need to disabled Edge colors to see the result.
This action take one parameter :
- Color scale : see Color Scale.
 Betweenness centrality coloration
This color action is an implementation of betweeness centrality parameter (see centrality for more details).
This action take several parameters :
Color scale : see Color Scale.
norm : If true :
- the node mesure will be normalized unweight not directed : m(n) = 2*c(n) / (#V - 1)(#V - 2)
- the node mesure will be normalized unweight directed : m(n) = c(n) / (#V - 1)(#V - 2)
- the edge mesure will be normalized unweight not directed : m(e) = 2*c(n) / (#V / 2)(#V / 2)
- the edge mesure will be normalized unweight directed : m(n) = c(n) / (#V / 2)(#V / 2)
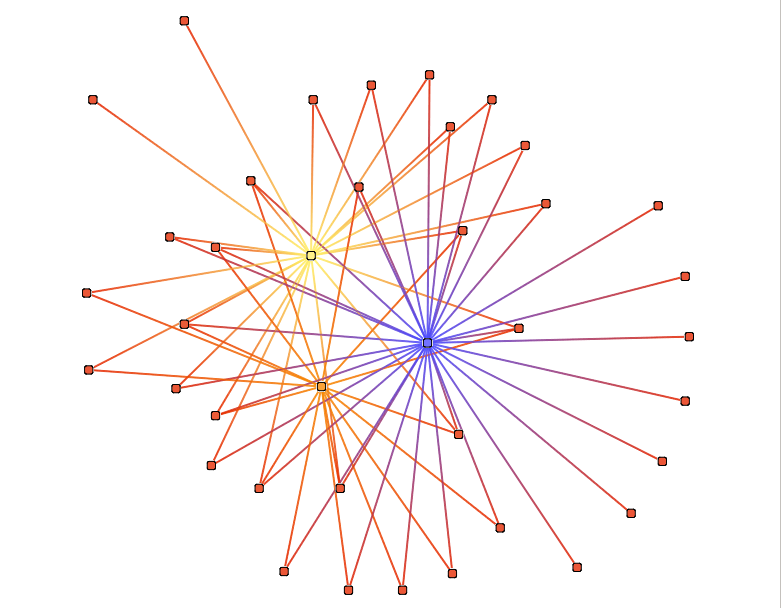
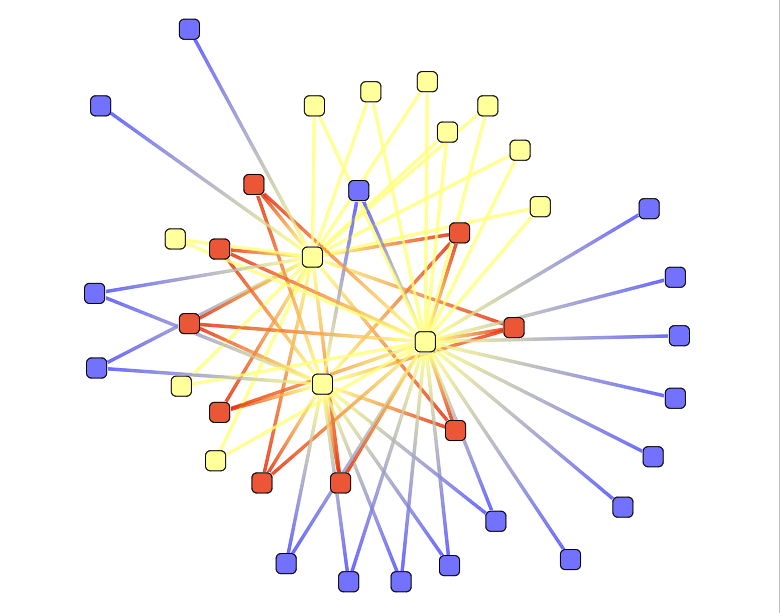
 Degree coloration
This action color nodes in the graph according to their degree.
This action take one parameter :
- Color scale : see Color Scale.
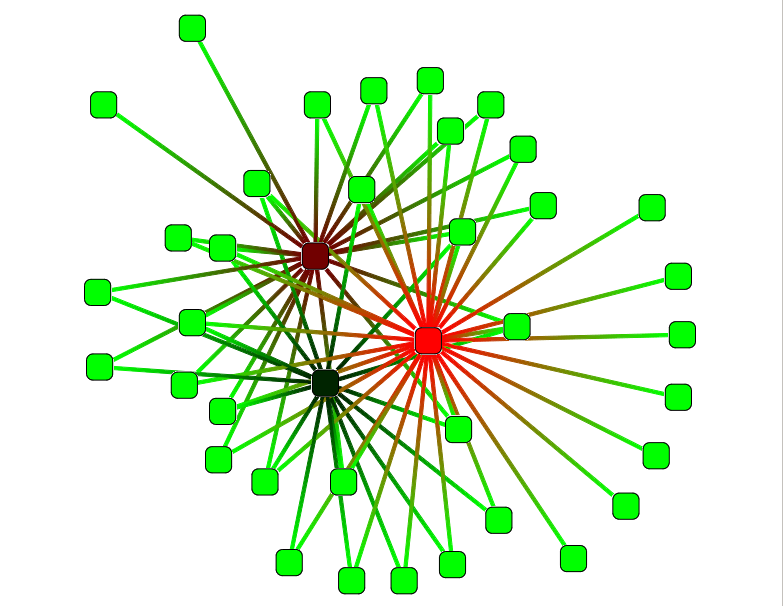
 Eccentricity coloration
This action color nodes in the graph according to their eccentricity. The eccentricity is the maximum distance to go from a node to all others.
This action take several parameters :
- Color scale : see Color Scale.
- closeness centrality : If true the closeness centrality will be computed (i.e. the mean of shortest-paths lengths from a node to others)
- directed : Indicates if the graph should be considered as directed or not.
- norm : If true the returned values are normalized. For the closeness centrality, the reciprocal of the sum of distances is returned. The eccentricity values is divided by the graph diameter. Warning : The normalized eccentricity values sould be computed on a (strongly) connected graph.
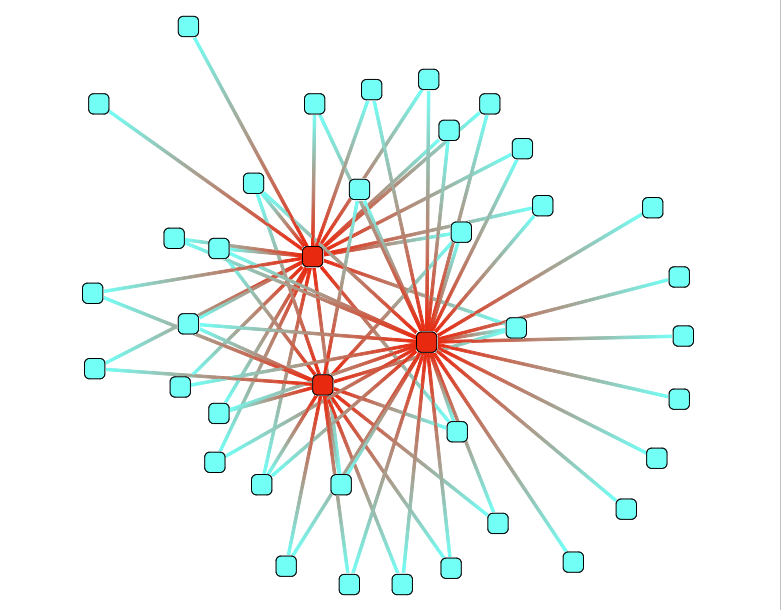
 Element types
This action color nodes according to their types : mRNA or sRNA.
This action take 2 parameters :
- mRNA Color : set the mRNA color
- sRNA Color : set the sRNA color
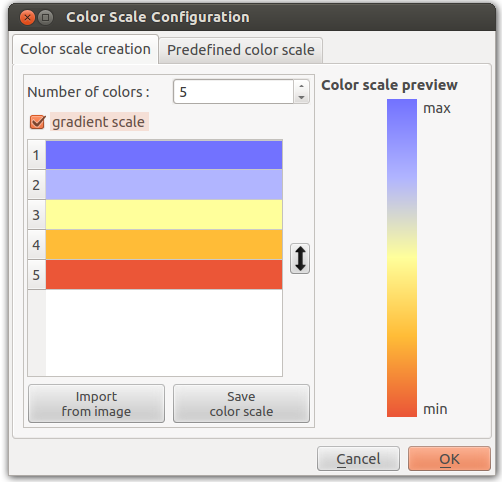
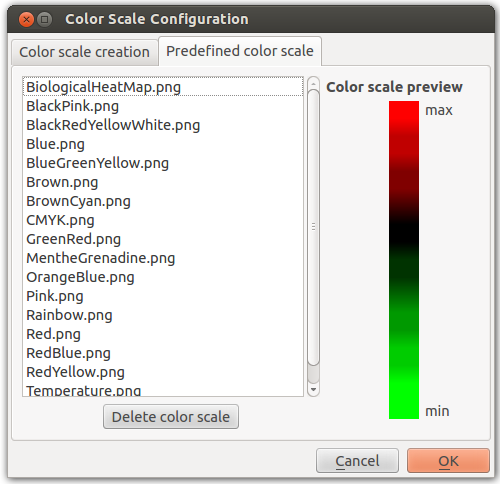
Color Scale
This parameter, available in most color actions, allow you to personalize the color scale who will be applied to the graph.
The color scale can be either gradient or predefined colors steps.
- If the color scale is a gradient, returned colors are interpolated in function of the position.
- If the color scale isn’t a gradient returned colors are the predefined colors steps.
 Layout actions
Their purpose is to position the nodes of the graph in an easily readable way. The two Force directed actions use force directed algorithms which simulates a spring and mass system.
 Efficient
A force directed action with good result. May be slow on very large networks.
 Fast
Fast
A faster force directed action.
 Calculation
Their purpose is to compute properties for the graph.
 DAVID Chart enrichement
Enrich your network with functional biological data from many public databases through DAVID[1] webservice. This action requires an internet connection and DAVID[1] account; If you don’t have one, go and register at
http://david.abcc.ncifcrf.gov/webservice/register.htm
- DAVID_login: your DAVID login, no password needed
- count: Minimum number of genes (RNAs) for the corresponding annotation term.
- threshold: Maximimum probability = Maximum score/P-Value
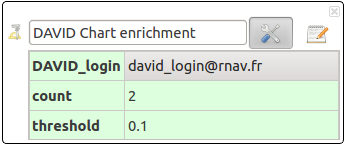
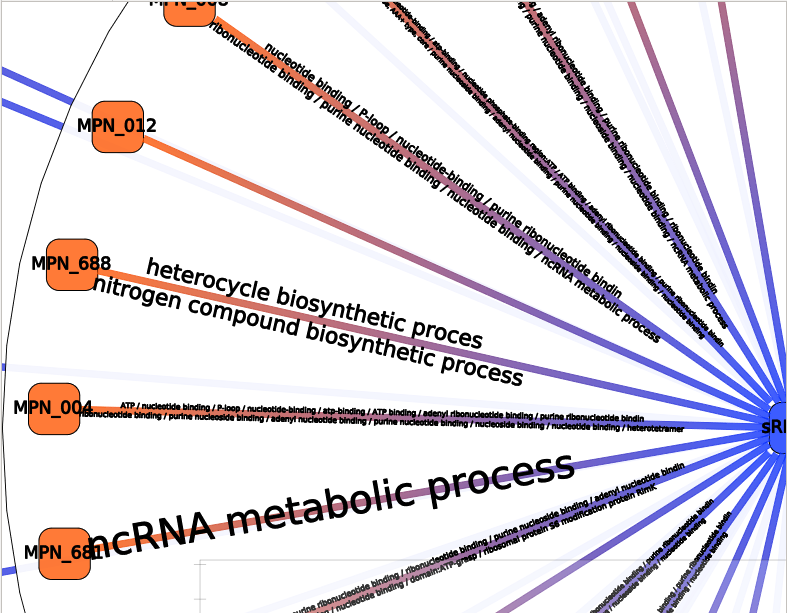
Fetching time depends on number of sRNAs. Use Annotations widget or Annotations (short) edge label to visualize collected annotations.
[1] D. W. Huang, B. T. Sherman, and R. A. Lempicki. Systematic and integrative analysis of large gene lists using david bioinformatics resources. Nat Protoc, 4(1):44–57, 2009.
 Annotation Clustering
Must be run on an enriched network. This action clusters interactions with close annotation terms.
- threshold: allows to tune how close two annotation sets must be, in order to be gathered in the same cluster.

The result should be observed with the Neighbors interactor:
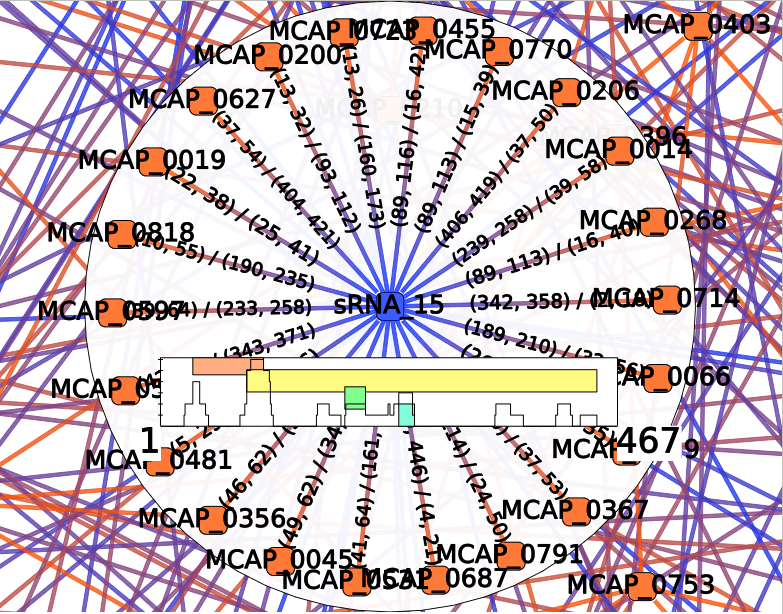
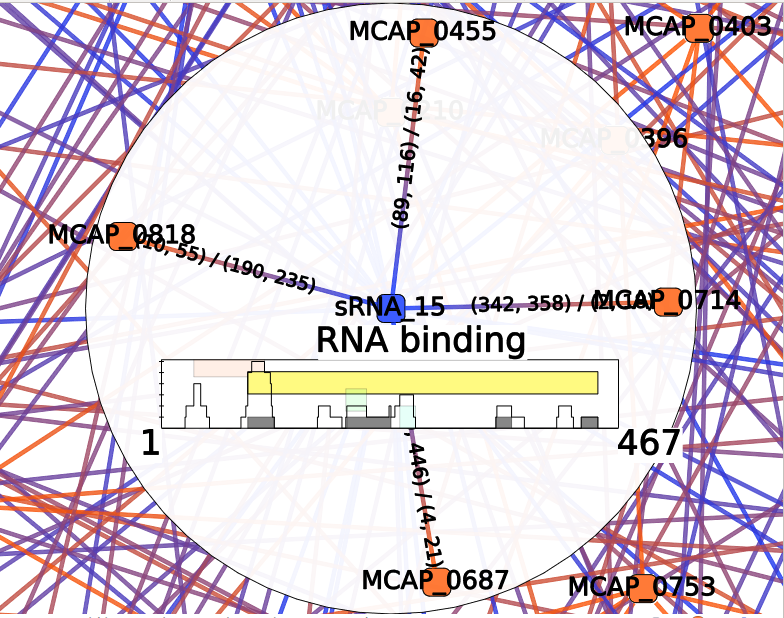
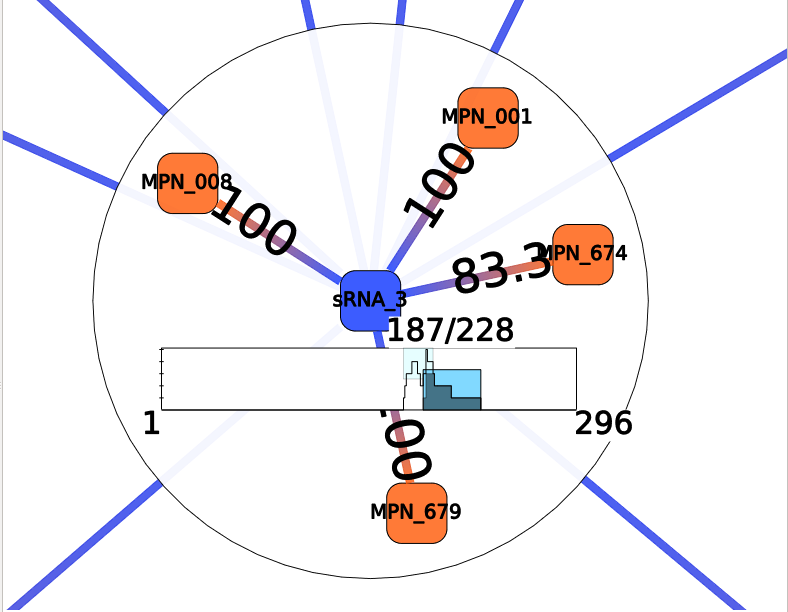
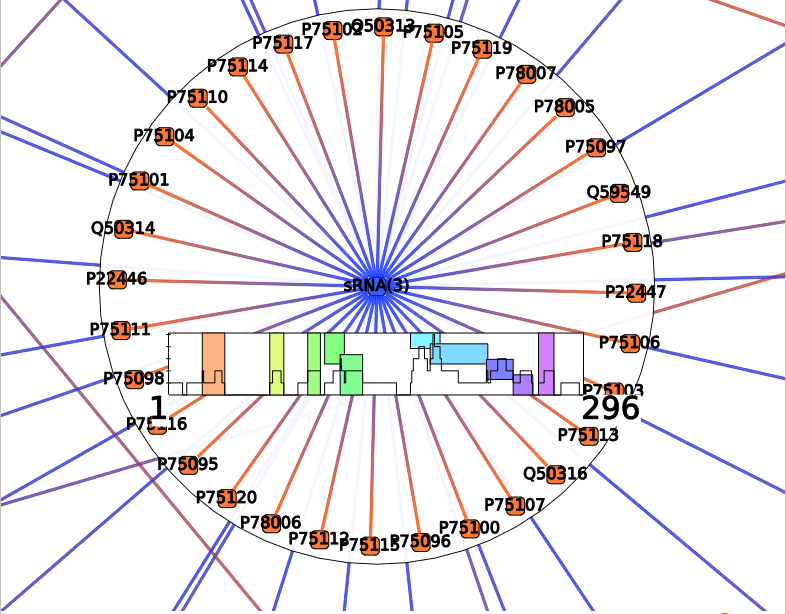
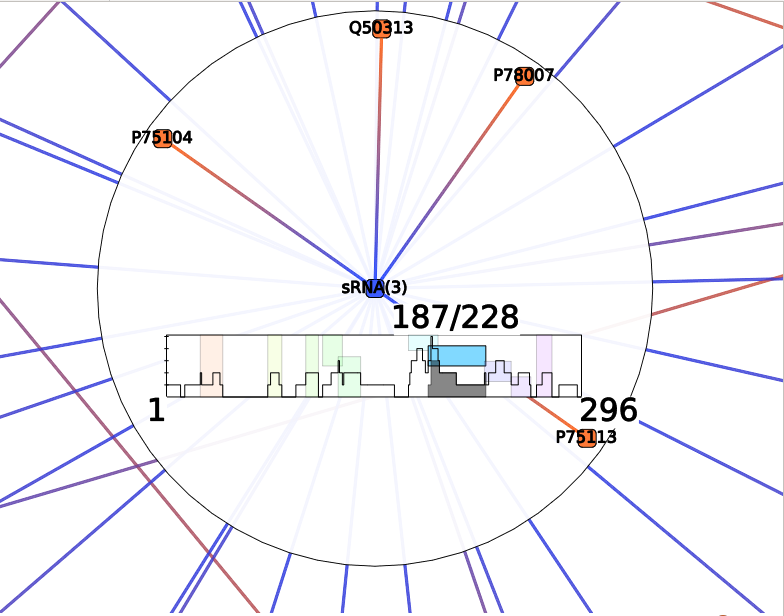
Each colored box represents a cluster of annotations, meaning a group of edges with close annotations. You can read the whole annotations list of the cluster by hovering this box. You will also see which edges are involved in the cluster. The little gray box under the frequency curve show (such as the frequency curve) the position of the predicted interaction on the sRNA (or mRNA if the center node of the interactor is a mRNA).
 Position Clustering
This action clusters mRNA-sRNA interactions from their position of interaction, using a Markov chain model. This action compute both RNA types (sRNAs and mRNAs).
- threshold: allows to tune how close two positions must be, in order to be gathered in the same cluster.

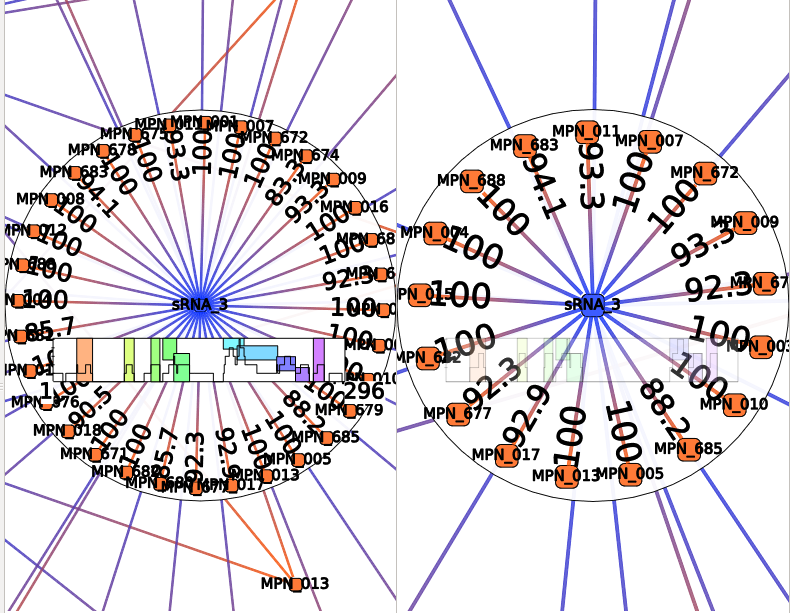
Such as for Annotation Clustering, the resulting colored boxes should be observed with the Neighbors interactor. Each colored box represent a cluster of mRNA-sRNA interactions that shared very close positions. You can visualize interactions involved in a cluster by hovering the colored box. Or select them by clicking on a box.
 Compute Betweenness Centrality
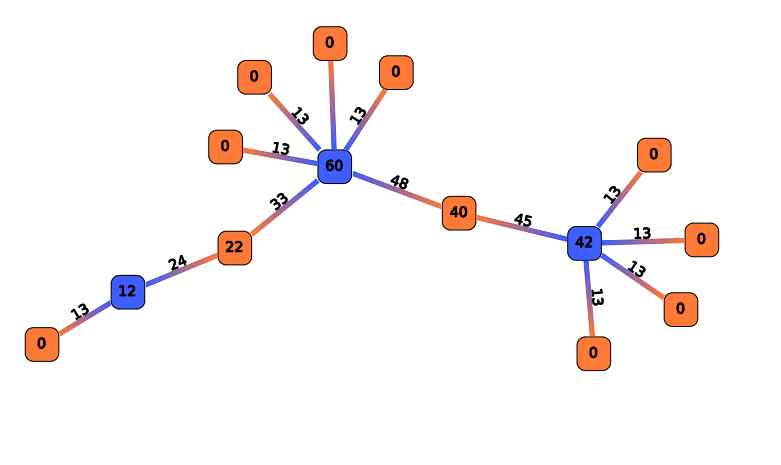
This action is an implementation of betweeness centrality parameter (see centrality for more details).
Compute a measure of centrality for each RNA. The results are stored in the Computation result node and edge labels.
No parameters.
 Compute Degree
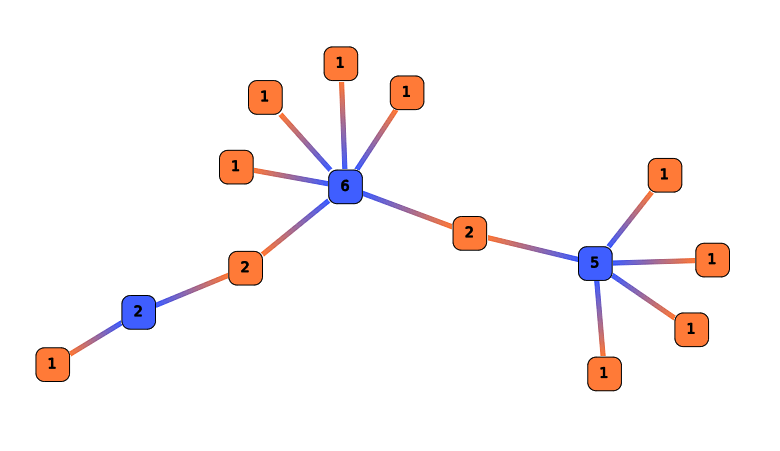
Degree computes, for each ARN, the number of neighbor. The results are stored in the Computation result node labels.
No parameters.
 Compute Eccentricity
Compute a measure of eccentricity for each node. The eccentricity is the maximum distance to go from a node to all others. The results are stored in the Computation result node labels.
No parameters.
